Genesis is OneStream’s new low-code dashboard builder. It makes creating dashboards faster and easier than ever, giving power users the freedom to build interfaces in minutes — without needing deep technical skills.
Genesis is OneStream’s novel way of building interfaces in a matter of minutes. With an easy to use plug-and-play style interface, it really bridges the gap between the average OneStream user and the advanced reporting capabilities of the system. Just like you would build out your own reporting Excel file for any specific need, you can build an interface in OneStream that suits your process the best. I have been playing around with the solution, and have written down my thoughts on in a blog.
What is genesis?
Genesis is a low-code dashboard builder. Just like compiling an IKEA closet and including the right drawers and features, Genesis is about compiling a dashboard and picking the right components to add. Components are called “content blocks” and all the possible components are organized in a library to pick from. Examples include cube views, KPI tiles, webpages and BI viewer components. You can also link existing dashboards to Genesis, like solutions from the solution exchange. Most content blocks are free to use, and are continuously added to provide more interface capabilities. Some of the blocks use AI, and those blocks will likely all be behind a paywall. One example is an AI building block for the summarization of comments: it collects comments that users wrote in their input forms, and then summarizes them together to make one story out of it.
Why use Genesis?
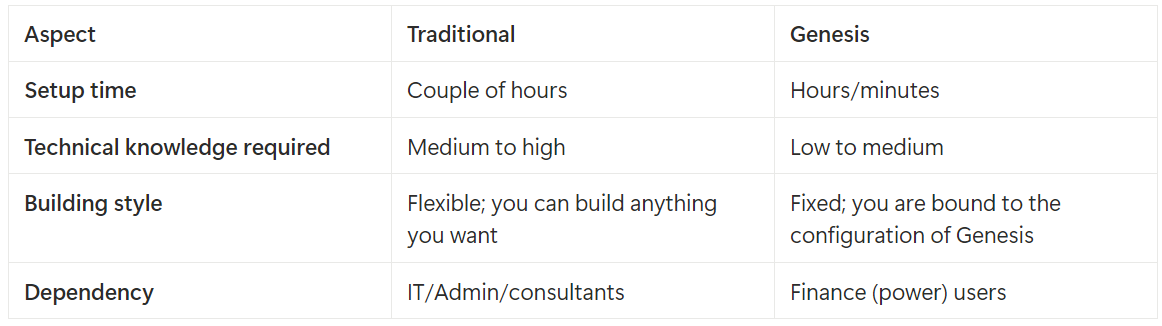
The interface is very intuitive, allowing you to build very nice interfaces without deep technical knowledge of dashboarding. This makes Genesis especially useful for power users, who don’t have the technical knowledge and simply want to build interfaces. It drastically reduces the time you need to build such interfaces. The content behind the content blocks (like Cube Views) still must be built yourself. A short comparison between traditional dashboard building and Genesis is provided below:
What is my experience?
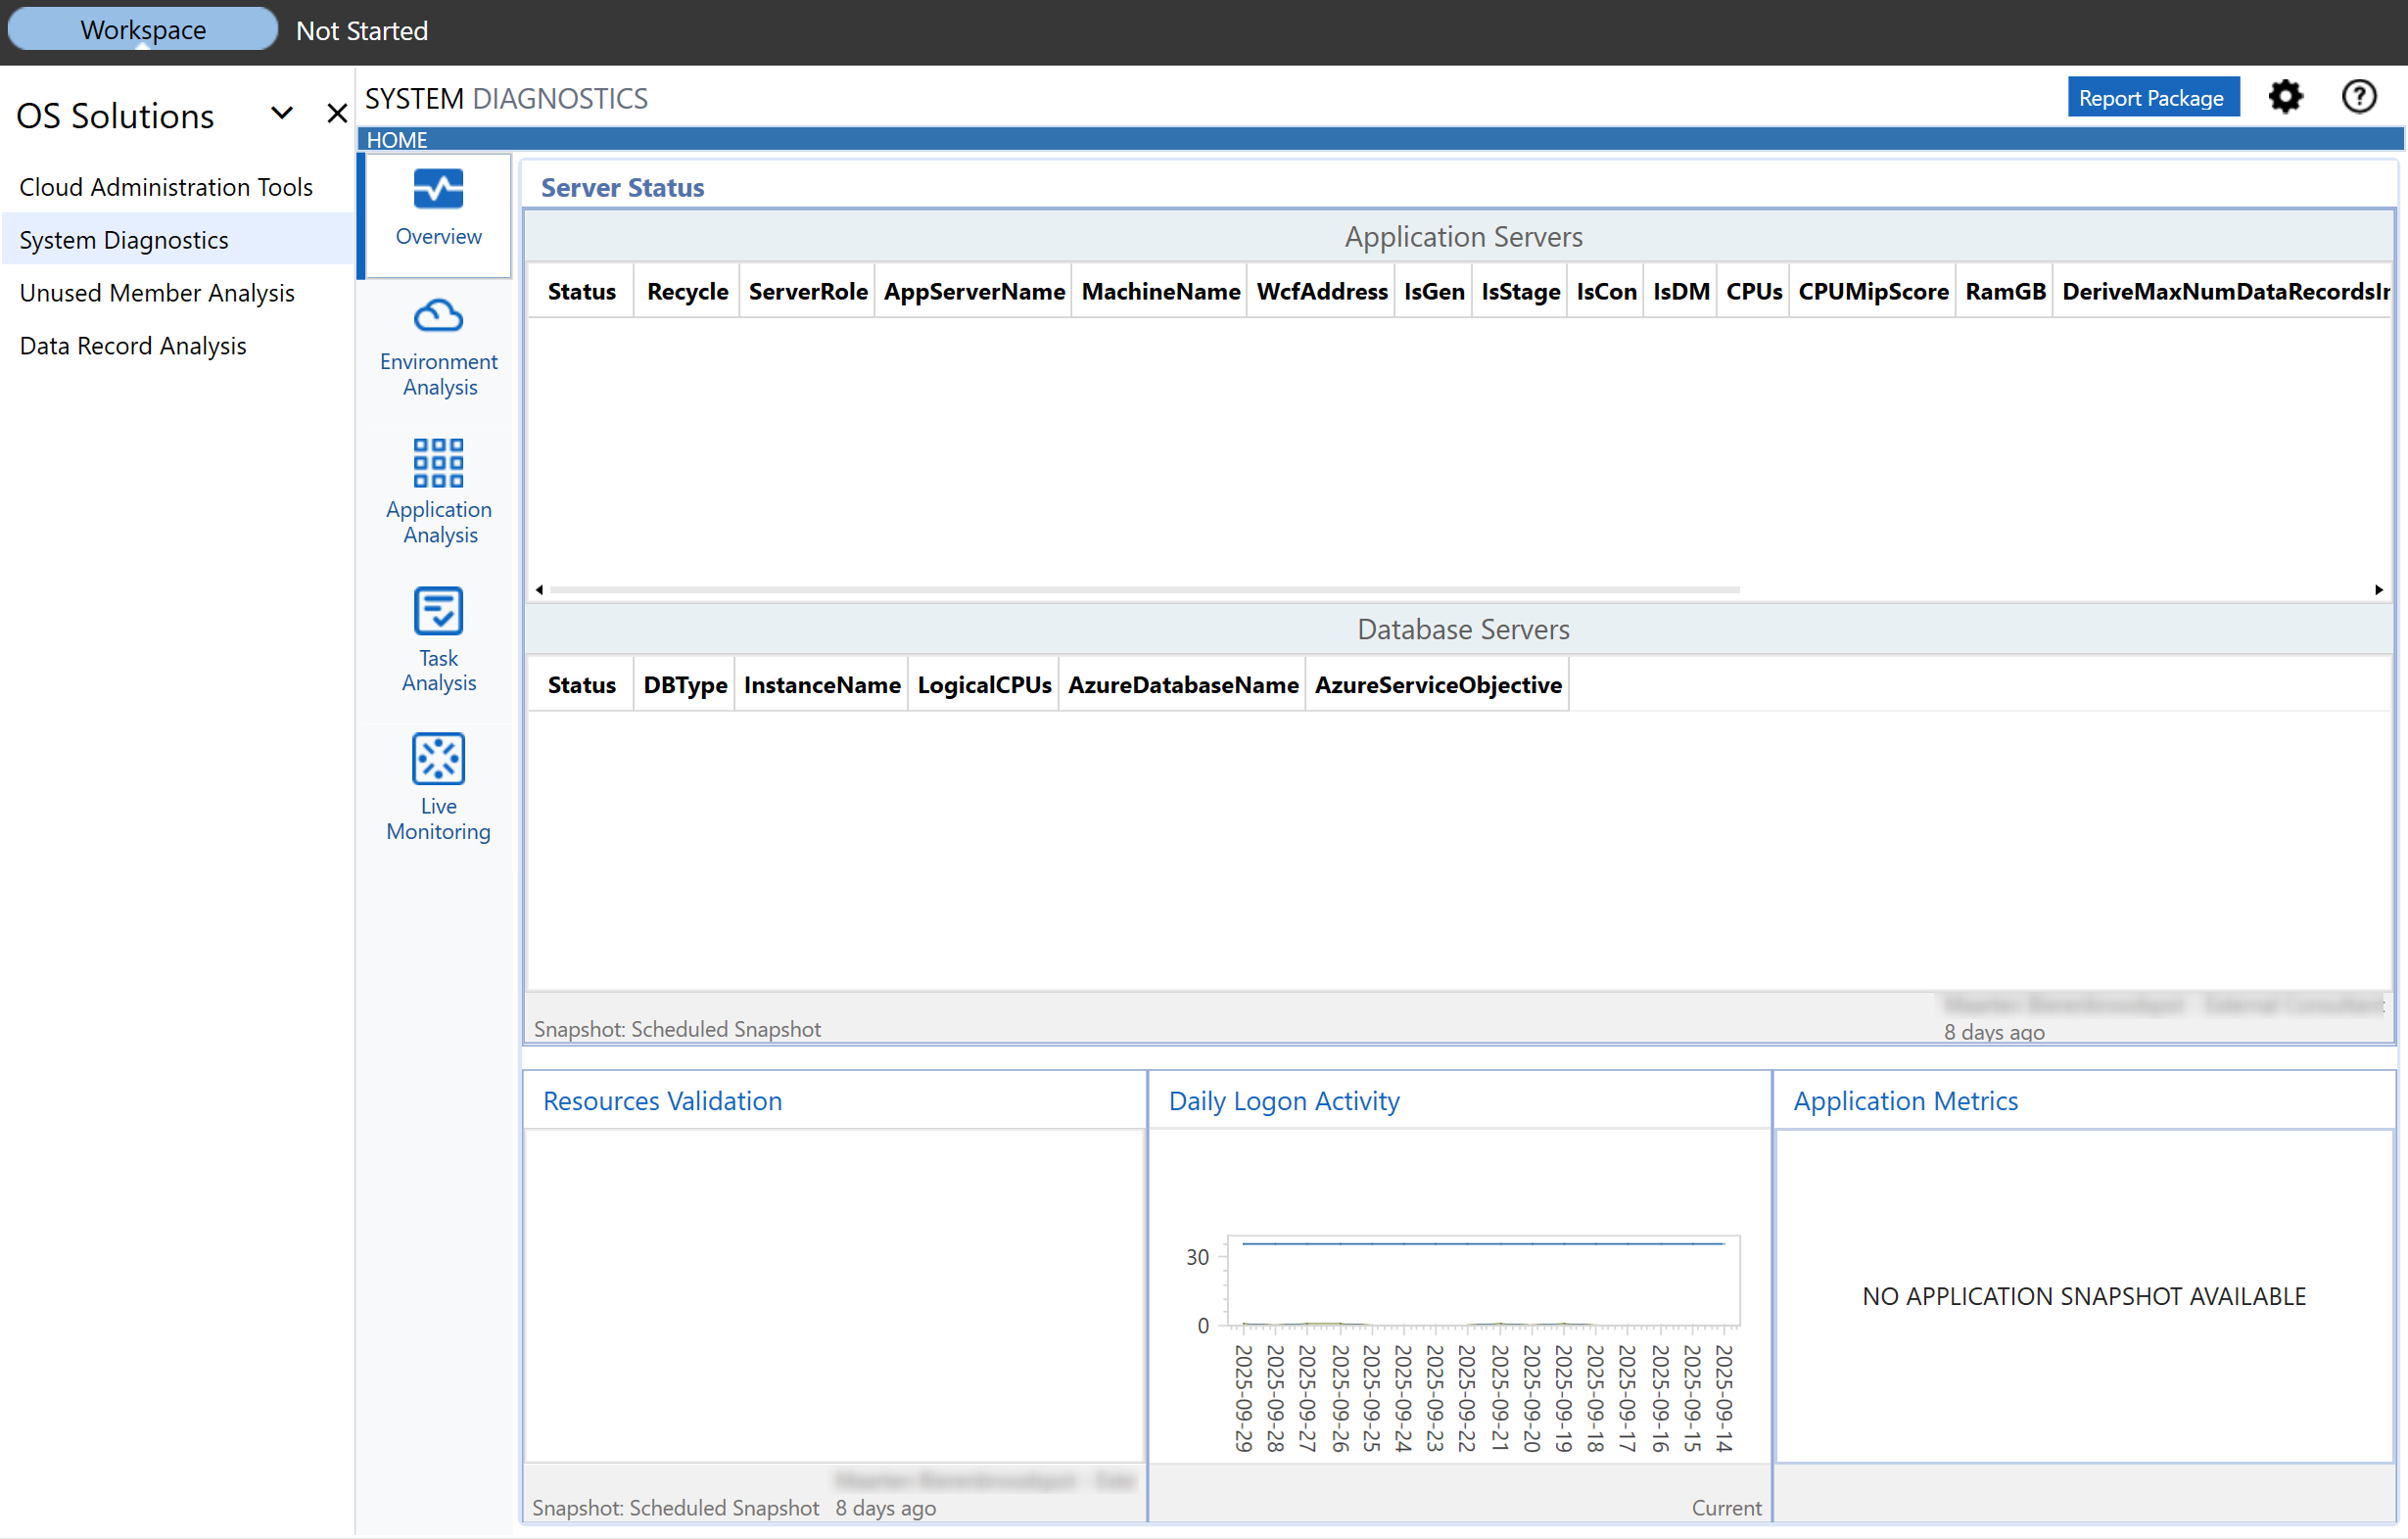
Since the time to build has reduced significantly, I’ve setout to build an interface with different solutions from the solution exchange, for example Cloud Administration Tools or System Diagnostics. As you can see in the image below, the pane OS Solutions shows the different solutions on the left side. By clicking on the different solutions, OneStream will show those solutions on the right side.
Setups like this I like to build, and especially in such a short time, since it makes it much easier for a OneStream administrator to find all of the relevant tools he or she needs to use. It’s really easy to put everything in one place. The way to connect the content blocks, or to link any dashboards, was quite simple to do. At the moment the Genesis dashboard was created, I did find it a bit difficult to find the dashboard that I was supposed to link to the workflow, but overall the workflow of dashboard creating was great.
Summary
I would regard Genesis as a great solution. It really acts as an enabler for report builders and alike. It opens up the door for power users for dashboarding in OneStream. Since they have a good knowledge of the processes they themselves and their direct colleagues use, I feel that Genesis can empower them to build interfaces that best meet their own specific requirements. Curious how Genesis could work for your reporting setup? Let’s connect.
