Drowning in Excel rows? Pivot tables can help. They transform raw data into insights by letting you summarize, filter, and analyze with just a few clicks. In this post, you’ll learn step by step how to create a pivot table - and why it’s one of the most powerful tools Excel has to offer.
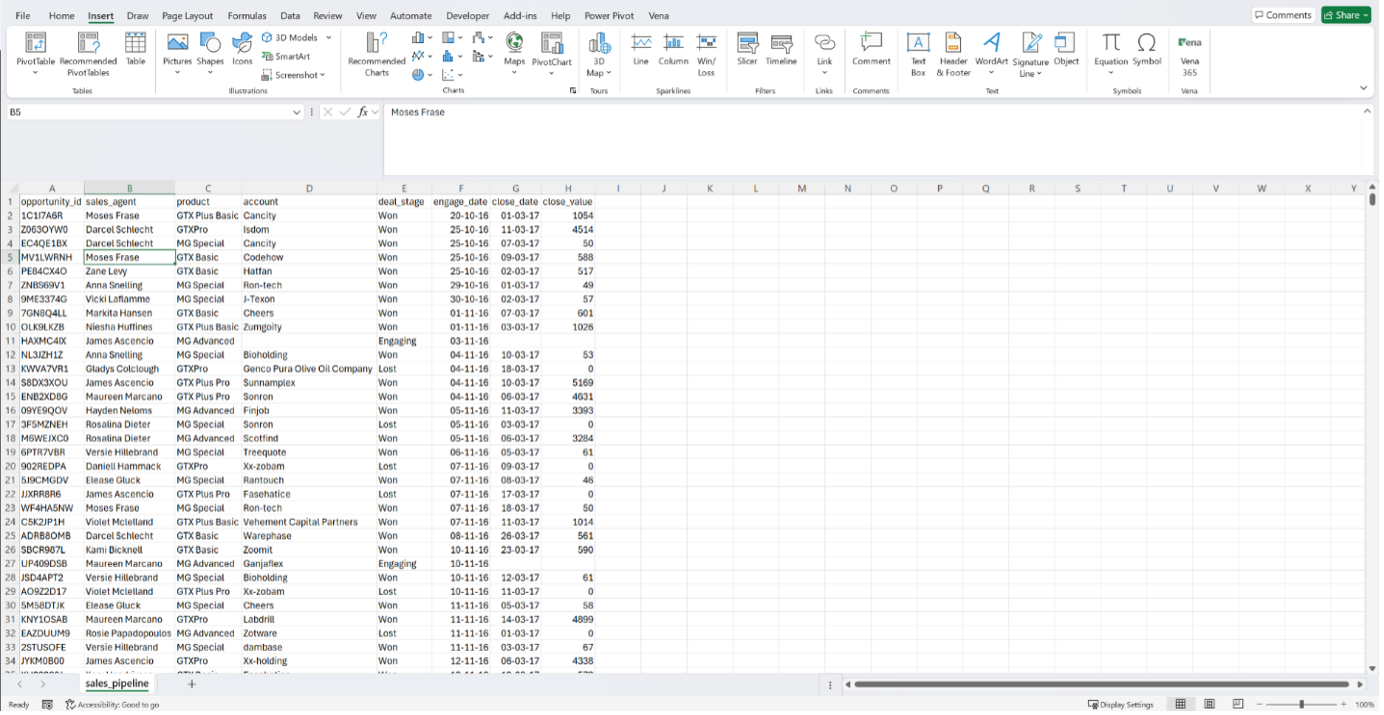
Select Your Data Range
Start by selecting the dataset you want to analyze. Make sure your data is structured in a table with clear headers. For example, if you’re working with sales data, each column might represent product, region, or revenue.
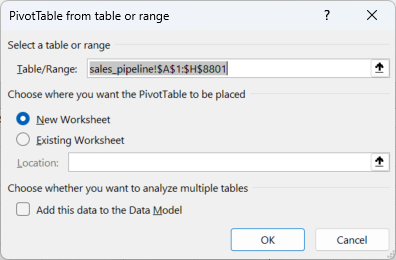
Insert a Pivot Table
Go to the Insert tab on the ribbon and click PivotTable. Excel will suggest the data range, but you can adjust it if needed. Choose whether to place your pivot table in a new worksheet or alongside your data.
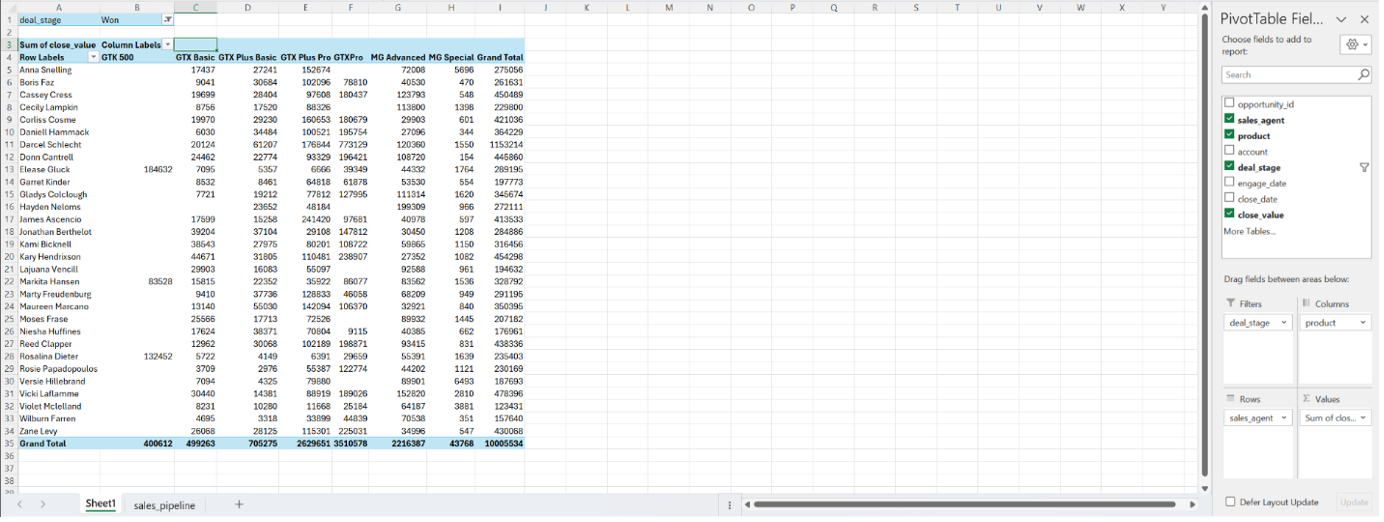
Configure Pivot Table Fields
Once inserted, you’ll see the Pivot Table Field List.Drag fields into Rows, Columns, Values, and Filters:
- Use Rows for categories (e.g., products, agents).
- Use Columns for comparative data (e.g., regions, months).
- Use Values for numbers (e.g., sales totals, averages).
- Use Filters to narrow down your view.

Build and Refine Your View
Decide what you want to analyze. For example, you might view total revenue per agent per product, filtering only for “won” deals. Then, refine using the PivotTable Analyze and Design ribbons - change layout, apply styles, or add slicers and timelines for interactive filtering.
Enjoy the Benefits
With your pivot table ready, you’ll notice several advantages:
- Summarization - Instantly see totals and averages.
- Flexibility - Rearrange fields to change perspectives.
- Efficiency - Automate manual calculations and refresh for new data.
- Interactive Analysis - Drill down and filter without recreating reports.
Conclusion
Pivot tables aren’t just a feature - they’re a shortcut to smarter decisions. By following these five steps, you can set up and refine pivot tables that make your data clear, flexible, and actionable. Ready to level up your reporting? Open Excel, create your first pivot table, and see how much time you save.
