An Excel dashboard is a one-page overview that shows your most important KPIs in charts and figures and lets users filter the data themselves. To create a dashboard in Excel, you define the KPIs your audience needs, load clean data into Excel tables or Power Query, summarise it with PivotTables, visualise it with charts, add slicers for interactivity and arrange everything on one sheet with a clear layout. Finance teams use Excel dashboards for monthly reporting, budget versus actual tracking, cash flow monitoring and sales performance. This guide takes you through the six steps, with examples and the mistakes we see most often in practice.
What Makes a Good Excel Dashboard?
The best dashboards have three things in common:
- Clarity – Focus on the few KPIs that matter to your target audience.
- Interactivity – Allow users to explore data with slicers, filters, and timelines.
- Storytelling – Organize visuals in a way that leads the reader from big picture to detail.
A good dashboard will lead the viewer to an opinion about the data, rather than showing them as many numbers as possible.
Step 1: Prepare Your Data
Clean, structured data is the foundation of any dashboard. Use Excel tables or Power Query to standardize inputs from different sources. A good practice is to organize your data within one or more hidden sheets within excel, which are labeled clearly for end users and future editors of the dashboard. You should avoid copy-pasting data into these sheets and automate this as much as possible, to avoid additional work and human-error.
Step 2: Build Visuals
Once the data is ready, bring it to life with visuals tailored to your audience. Here are 5 examples of visuals and how they can be used within your dashboard:
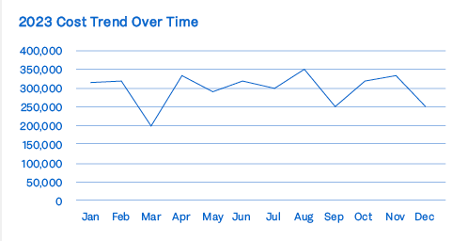
- Line charts – Show trends over time for quick pattern spotting
- Bar & column charts – Compare categories side by side clearly
- Bullet charts – Track progress against a target in a compact way
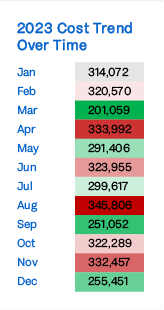
- Heat maps – Highlight highs and lows in large tables with color
- Sparklines – Display tiny, in-cell trends without taking space
The right chart makes the insight instantly obvious, allowing you to get your point across.
Step 3: Add Interactivity
Great dashboards let users choose their focus areas without touching formulas. In Excel, this means
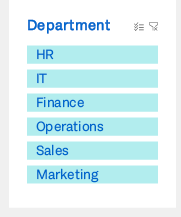
- Slicers & timelines - Filter data by department, region, or period with one click.
- Dropdowns & form controls - Switch between KPIs or test ''What-if'' scenarios.
For example, you might add region filter for an HR dashboard or model the impact of different revenue growth assumptions.
Step 4: Design for Impact
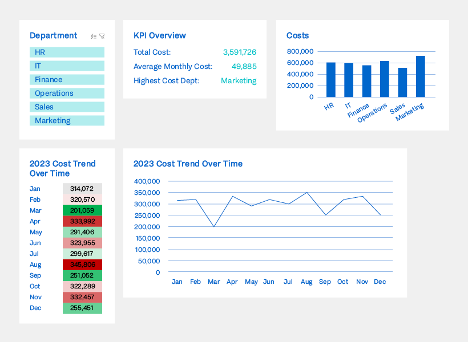
A dashboard is as much about layout as content. Keep it clean so that users don’t get overwhelmed with data and the purpose is clear:
- Use a 1-page design with no more than 3-4 main sections.
- Apply a consistent color scheme (e.g., green for positive, red for negative).
- Leave white space to avoid clutter and guide the eye naturally.
Think of your dashboard from the end-user perspective. Only keep the information that is absolutely necessary for them, and make your intended purpose clear.
Best Practices & Pitfalls
Do’s:
- Define KPIs with your audience in mind.
- Automate data refresh wherever possible.
- Stick to simple, effective visuals.
Don’ts:
- Overload with too many charts.
- Use flashy 3D graphs (they distort numbers).
- Rely on manual updates (they can lead to human errors).
When is Excel no longer enough?
Excel is flexible and almost every finance team knows it, which makes it a good starting point for dashboards. You will run into its limits when:
- Several people need to update the same file at the same time.
- Large data volumes slow down the workbook.
- You need an audit trail, version control or approval workflows.
- Planning, forecasting and consolidation run across dozens of linked files.
At that point, a BI tool like Power BI or an EPM platform such as OneStream, Anaplan, Board or Vena is the next step. Vena, for example, keeps the familiar Excel interface on top of a central database. Our Tech Selection team helps you choose the tool that fits your processes, people and IT landscape.
Conclusion
Excel dashboards give your teams the ability to turn static reports into dynamic stories. They save time, improve accuracy, and make analysis accessible to decision-makers. Start with the absolute most important information and expand from there when needed.
While Excel is not specifically built for creating dashboards, its flexibility and common use within businesses makes it a great starting point for some basic dashboards.
